![]()


Geographic visualisations for models' goodness of fit
geogof is a Python library for creating map-centric visualizations to assess the goodness of fit between hydrologic models and observed data. The library stems from the observation that the author(s) had recurring needs for exploring model performance on maps (static or interactive) and kept repurposing or reinventing ad-hoc code for various projects. geogof will deliberatrly focus on visualisation, not data analysis or model calibration.
- interactive dashboards: ipyleaflet, perhaps folium.
- static maps: matplotlib.
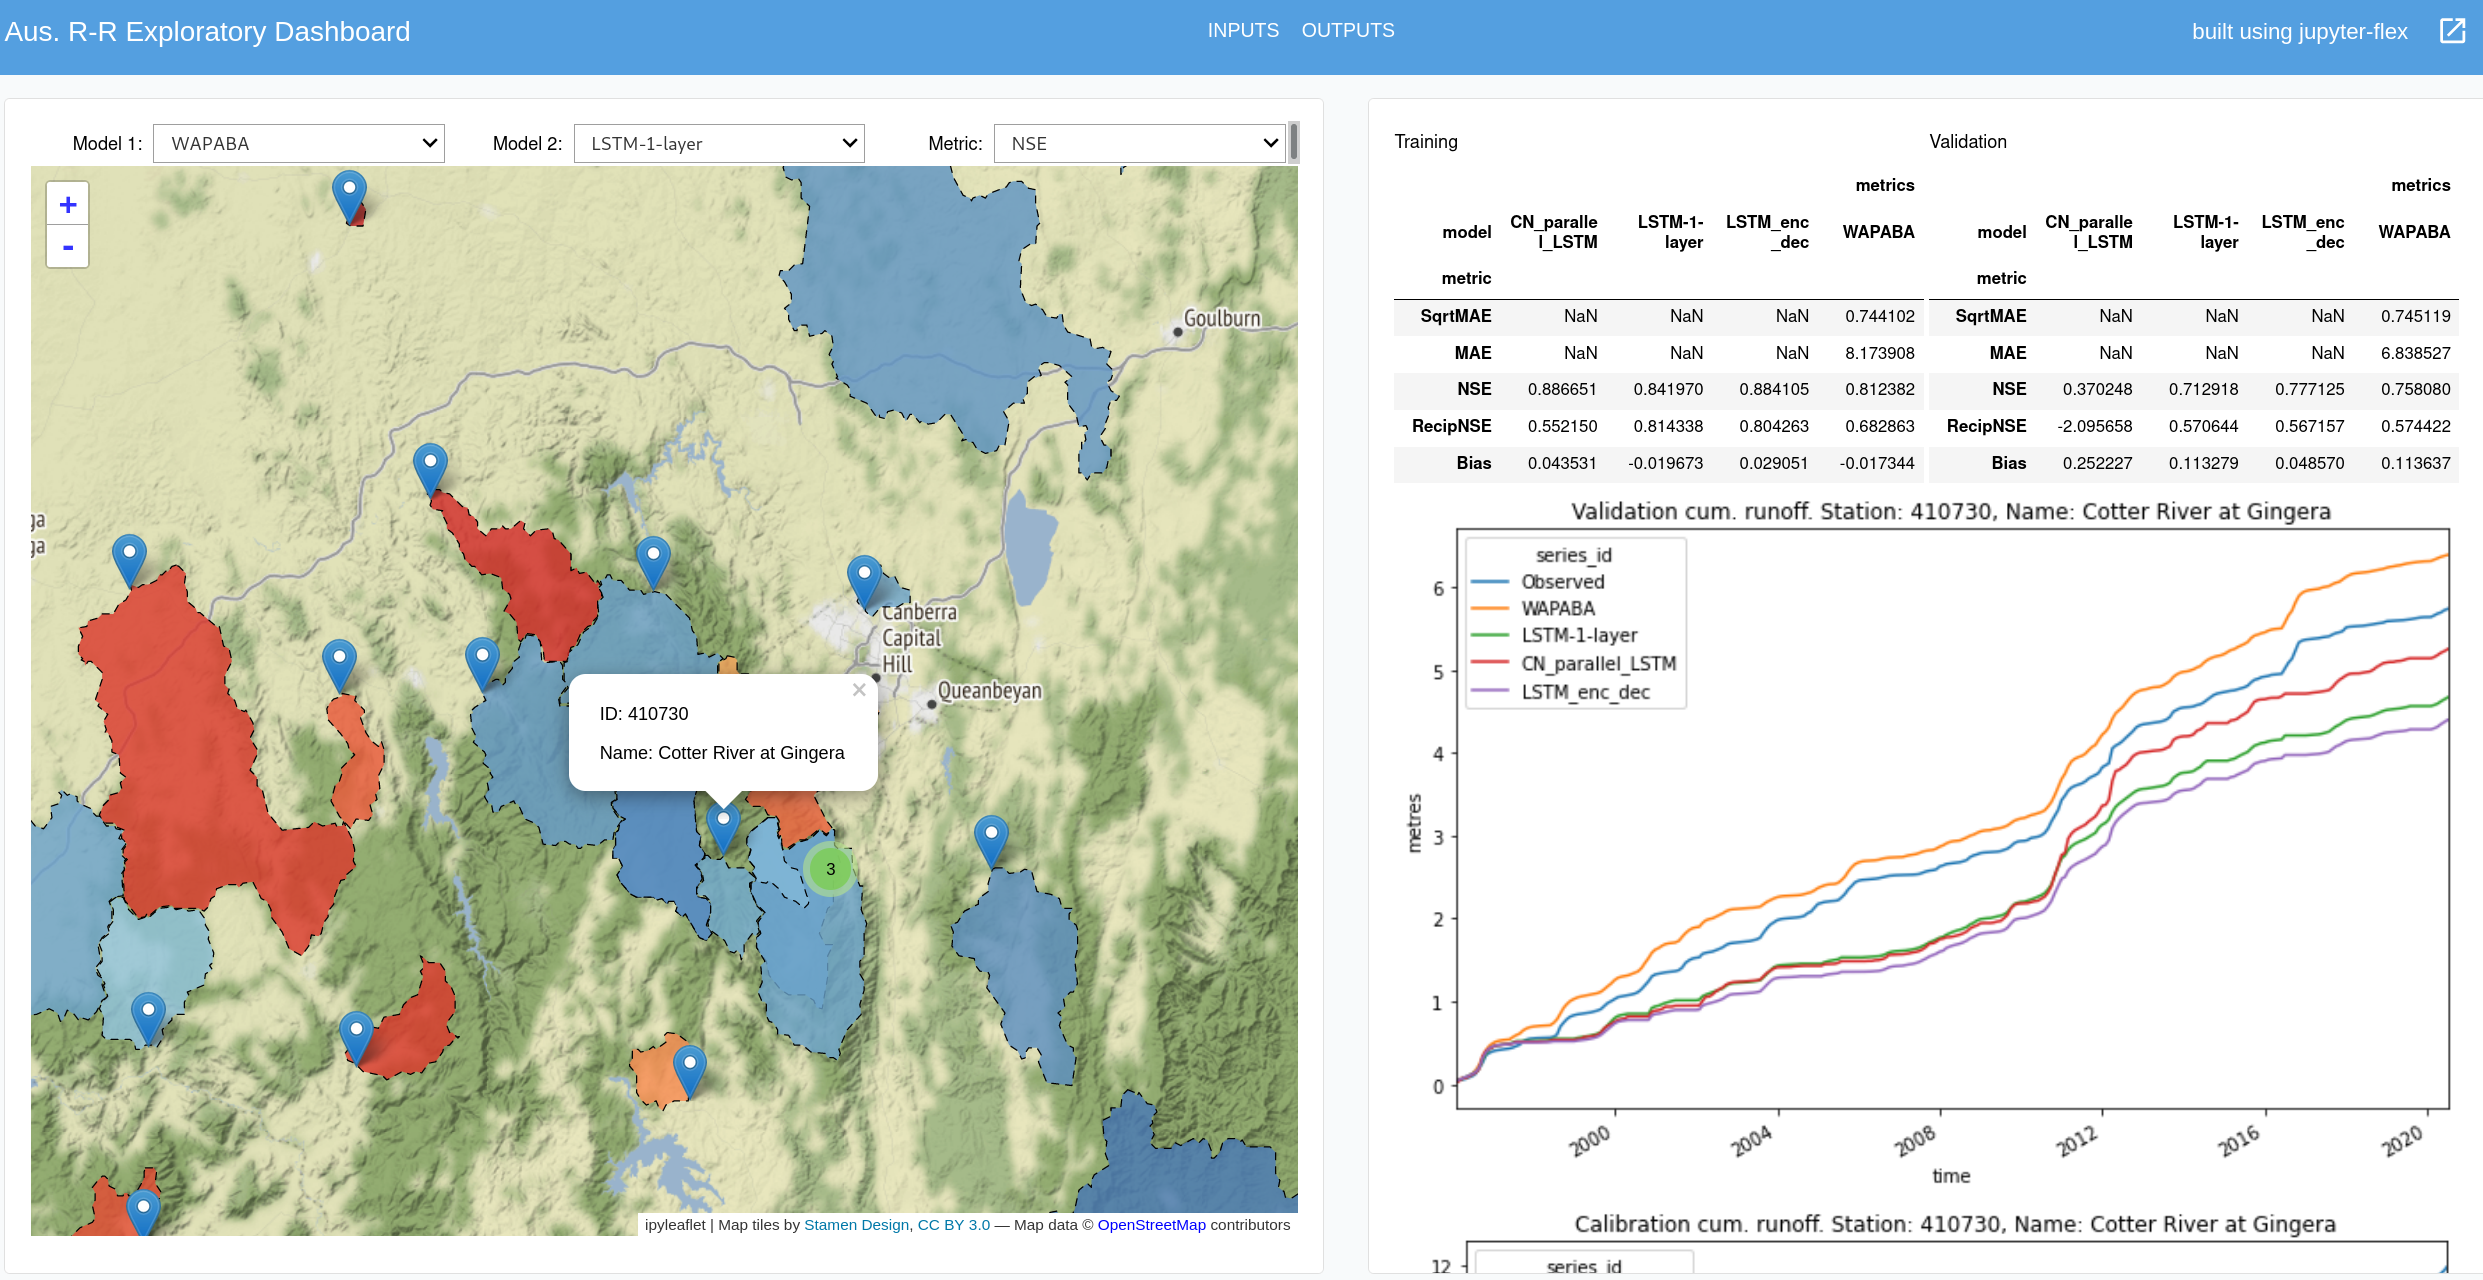
A prior example, to give a visual idea of the intented use (from monthly-lstm-runoff):
This package is also the occasion to learn using copier-uv for python packaging techniques and best practices.
from source:
cd path/to/geogof
uv pip install -e .
or, in a requirement.txt file:
geogof @ git+https://github.com/csiro-hydroinformatics/geogof@mainPlaceholder as of dec 2024 Down the track this package may be installable via pip and uv.
pip install geogofuv tool install geogof