This project aims to provide a comprehensive analysis of the Adidas sales trends between 2020 and 2021, highlighting the top-selling products and retailers. By delving deep into the data, we have identified the best-selling region in terms of sales and profit, which can guide the development of future sales strategies. Our sales report showcases insightful and actionable information, enabling stakeholders to make informed decisions and drive business growth.
To execute this analysis on Adidas sales across 2020 and 2021, a publicaly available dataset downloaded from kaggle was used. The dataset is a structured in a tabular .csv data with over 9,000 rows and 10 columns.
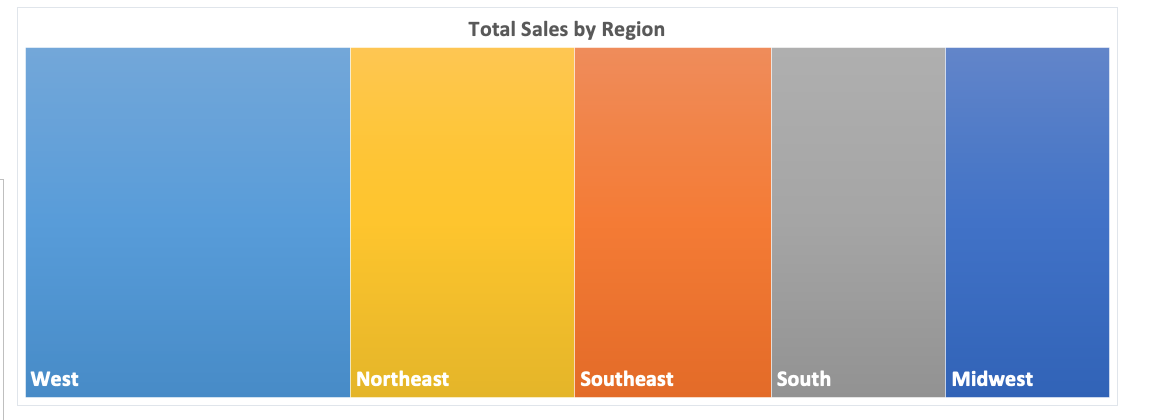
- Hierarchy graph shows the total sales for each region and how they contribute to the overall sales total. This information can be used to identify which regions are the most profitable and which ones may need additional resources or attention.
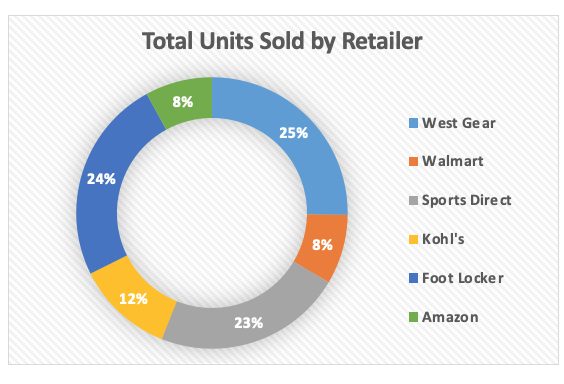
- This chart shows the number of units sold by each retailer, which helps identify which retailers are driving the most sales. This information can be used to prioritize marketing efforts and build stronger relationships with high-performing retailers.
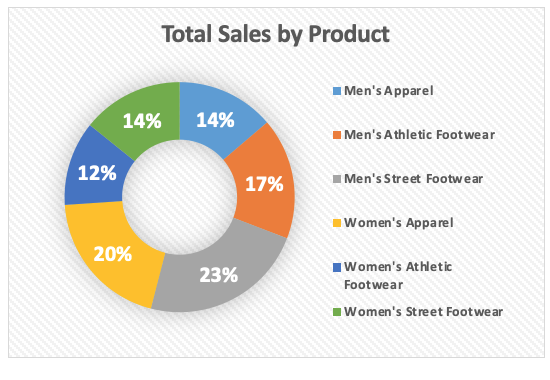
- This chart shows the total revenue generated by each product, which helps identify which products are the most popular and profitable. This information can be used to optimize product development and marketing strategies.
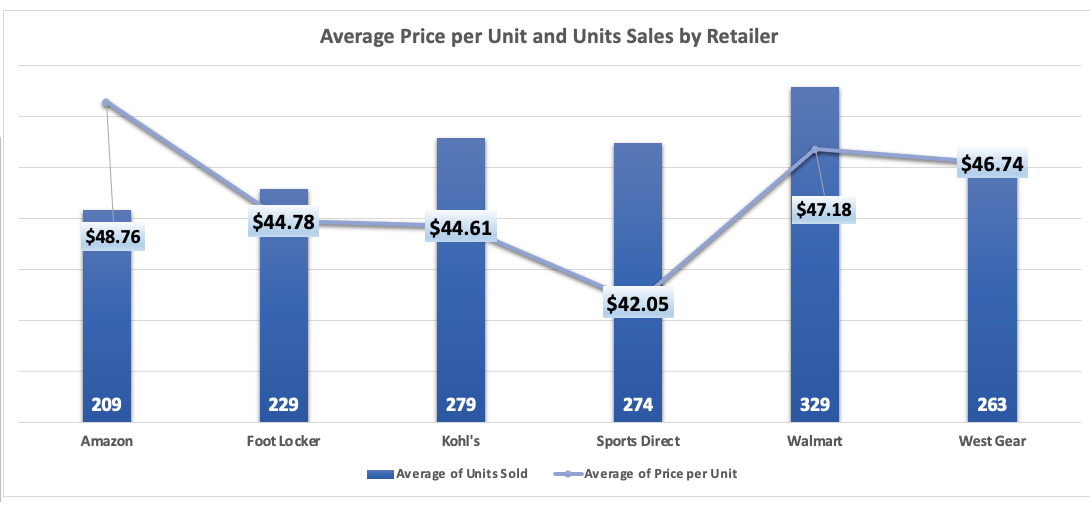
- This chart shows the average price per unit and the number of units sold by each retailer, which helps identify pricing and sales strategies that are most effective for each retailer. This information can be used to optimize pricing and sales strategies for different retailers
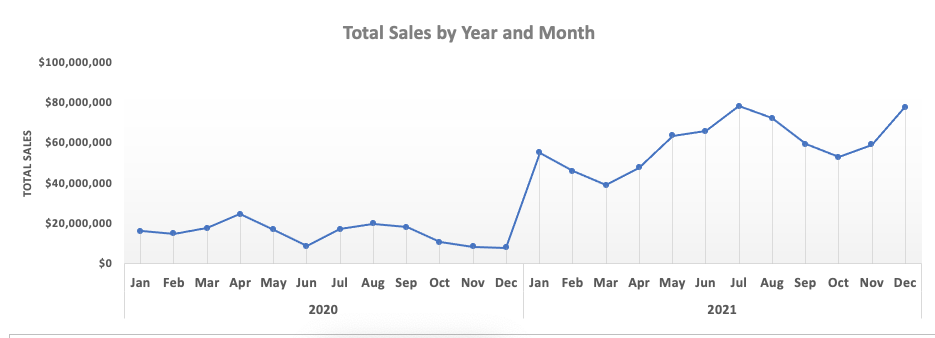
- This chart shows the total sales for each month and year, which helps identify trends and seasonality in sales data. This information can be used to adjust marketing and sales strategies based on seasonal patterns.
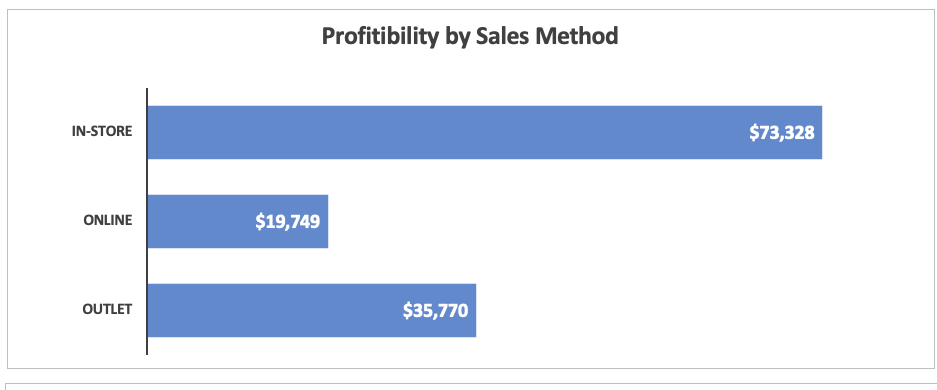
- This chart shows the profitability of each sales method, such as online sales, in-store sales, and direct sales. This information can be used to identify which sales methods are the most effective and profitable.
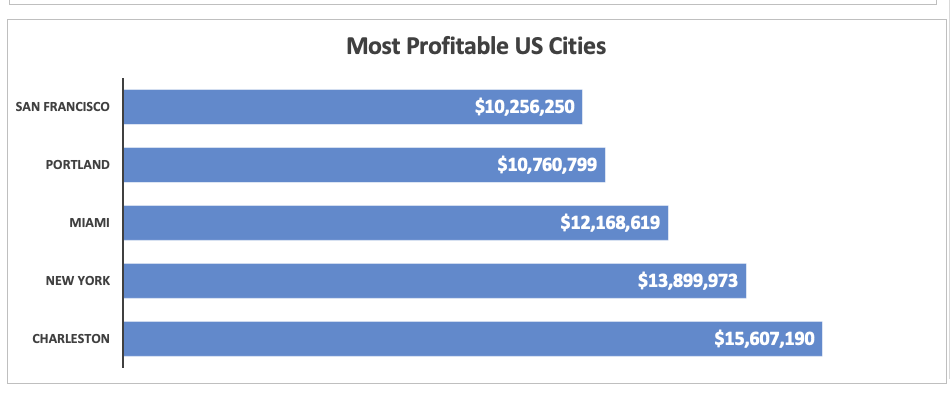
- This chart shows the top cities in terms of profitability, which helps identify which markets are the most lucrative. This information can be used to target marketing efforts and allocate resources more effectively.